Turning Data Into Clear Decisions
Helping nonprofits, health orgs, and small businesses unlock insight and take action with confidence.

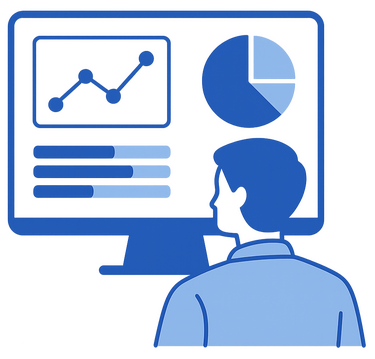
Insight-Driven Data Consulting for Nonprofits & Local Businesses
From public health data to customer surveys, Lumexa Analytics helps mission-driven teams clean, analyze, and visualize data—so you can make smarter decisions and deliver measurable impact.
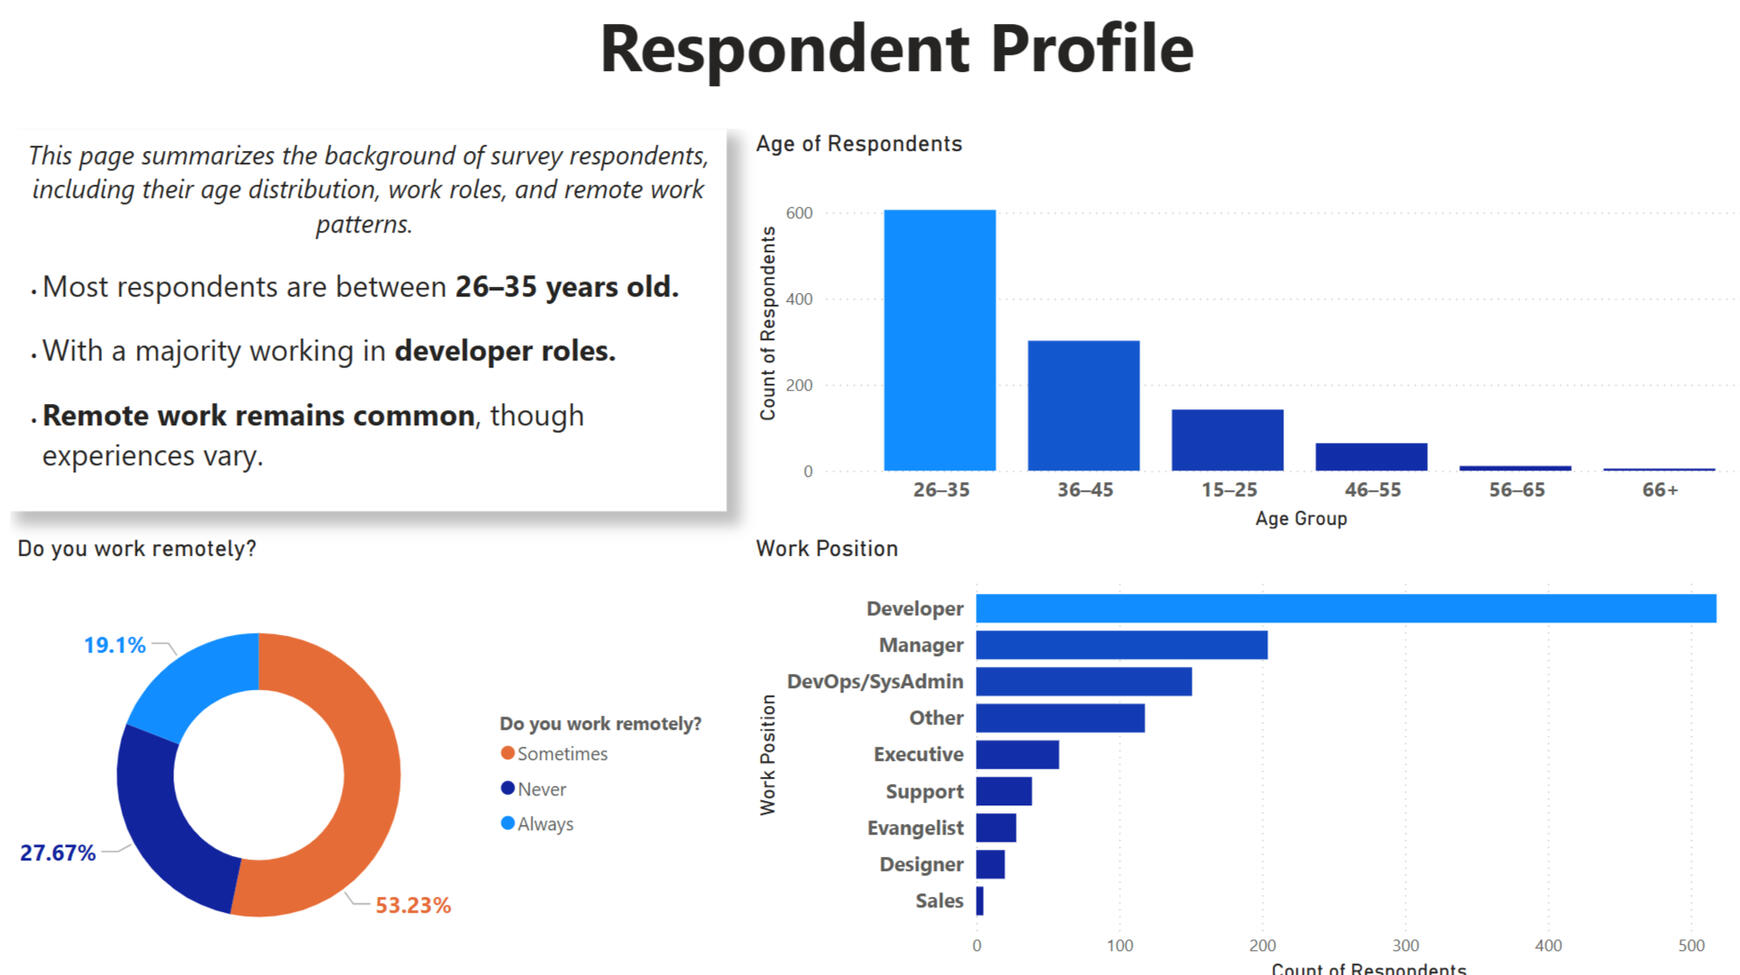
Strategic Survey Reports
Clean, structure, and visualize raw survey results into interactive insights that highlight trends in community health, service satisfaction, or stakeholder feedback.
Power BI Performance Dashboards
Track Progress. Drive Results.
Our Power BI Performance Tracker helps organizations monitor CHIP or QI goals, visualize progress across priority areas, and make data-driven decisions—all in one place. Fully branded, user-friendly, and Excel-integrated.
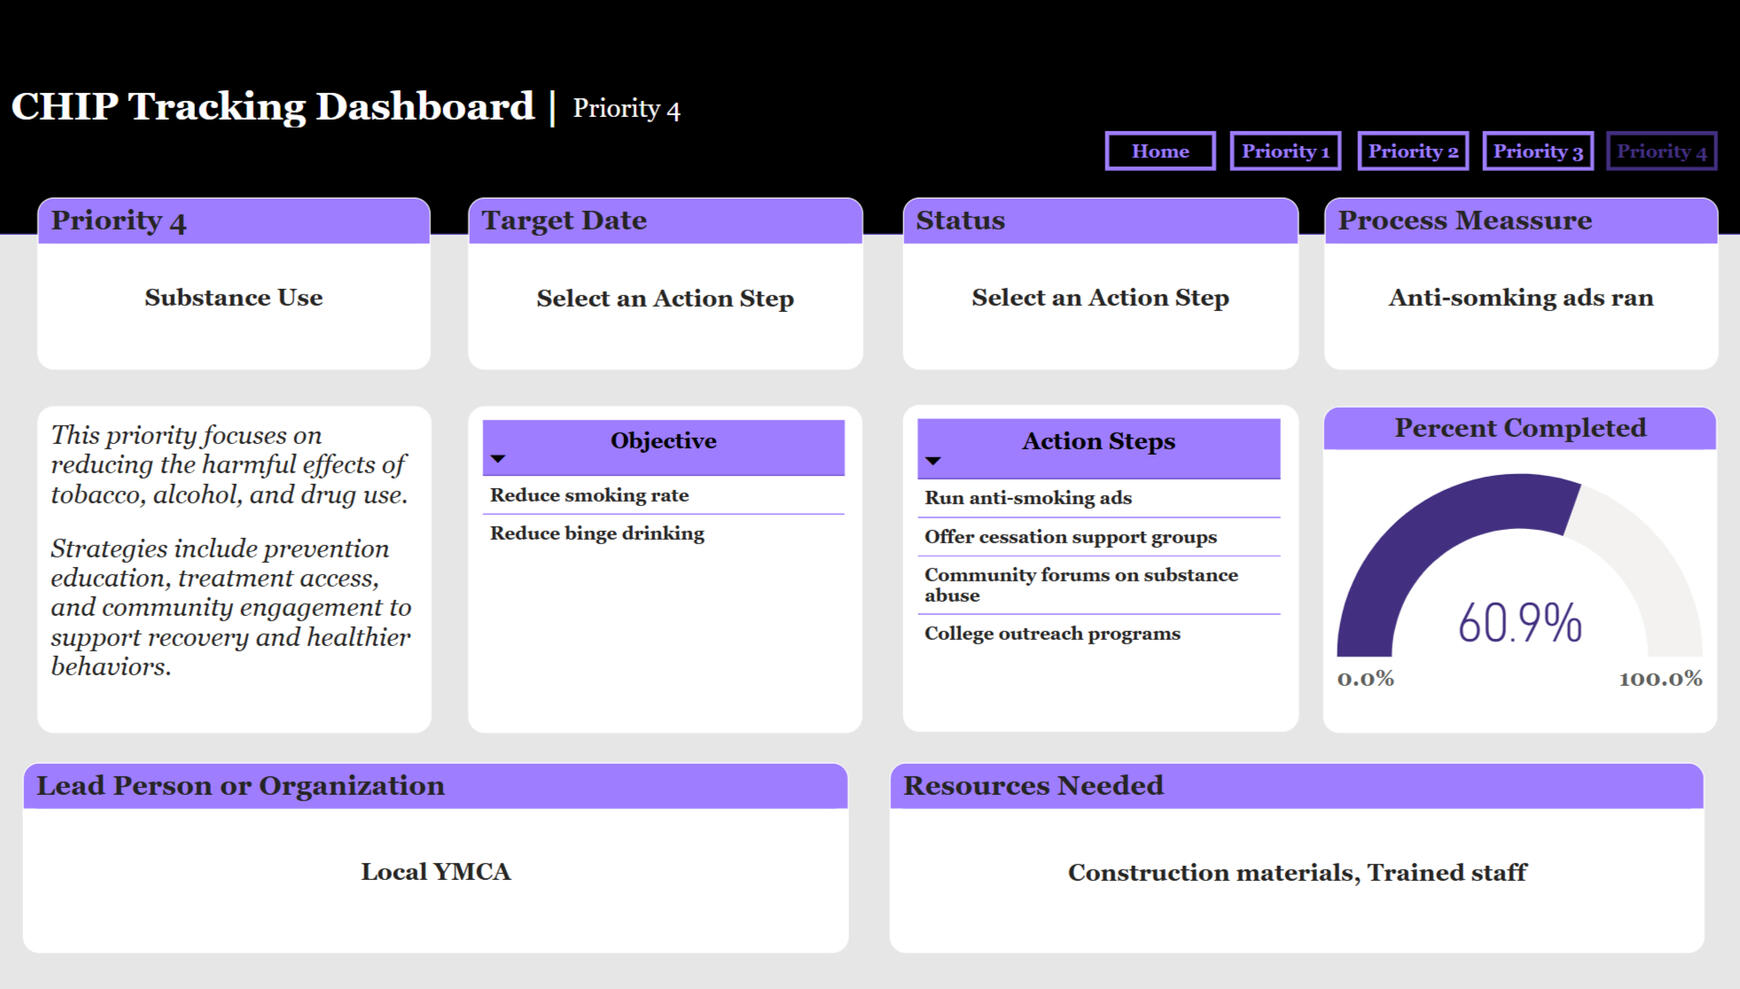
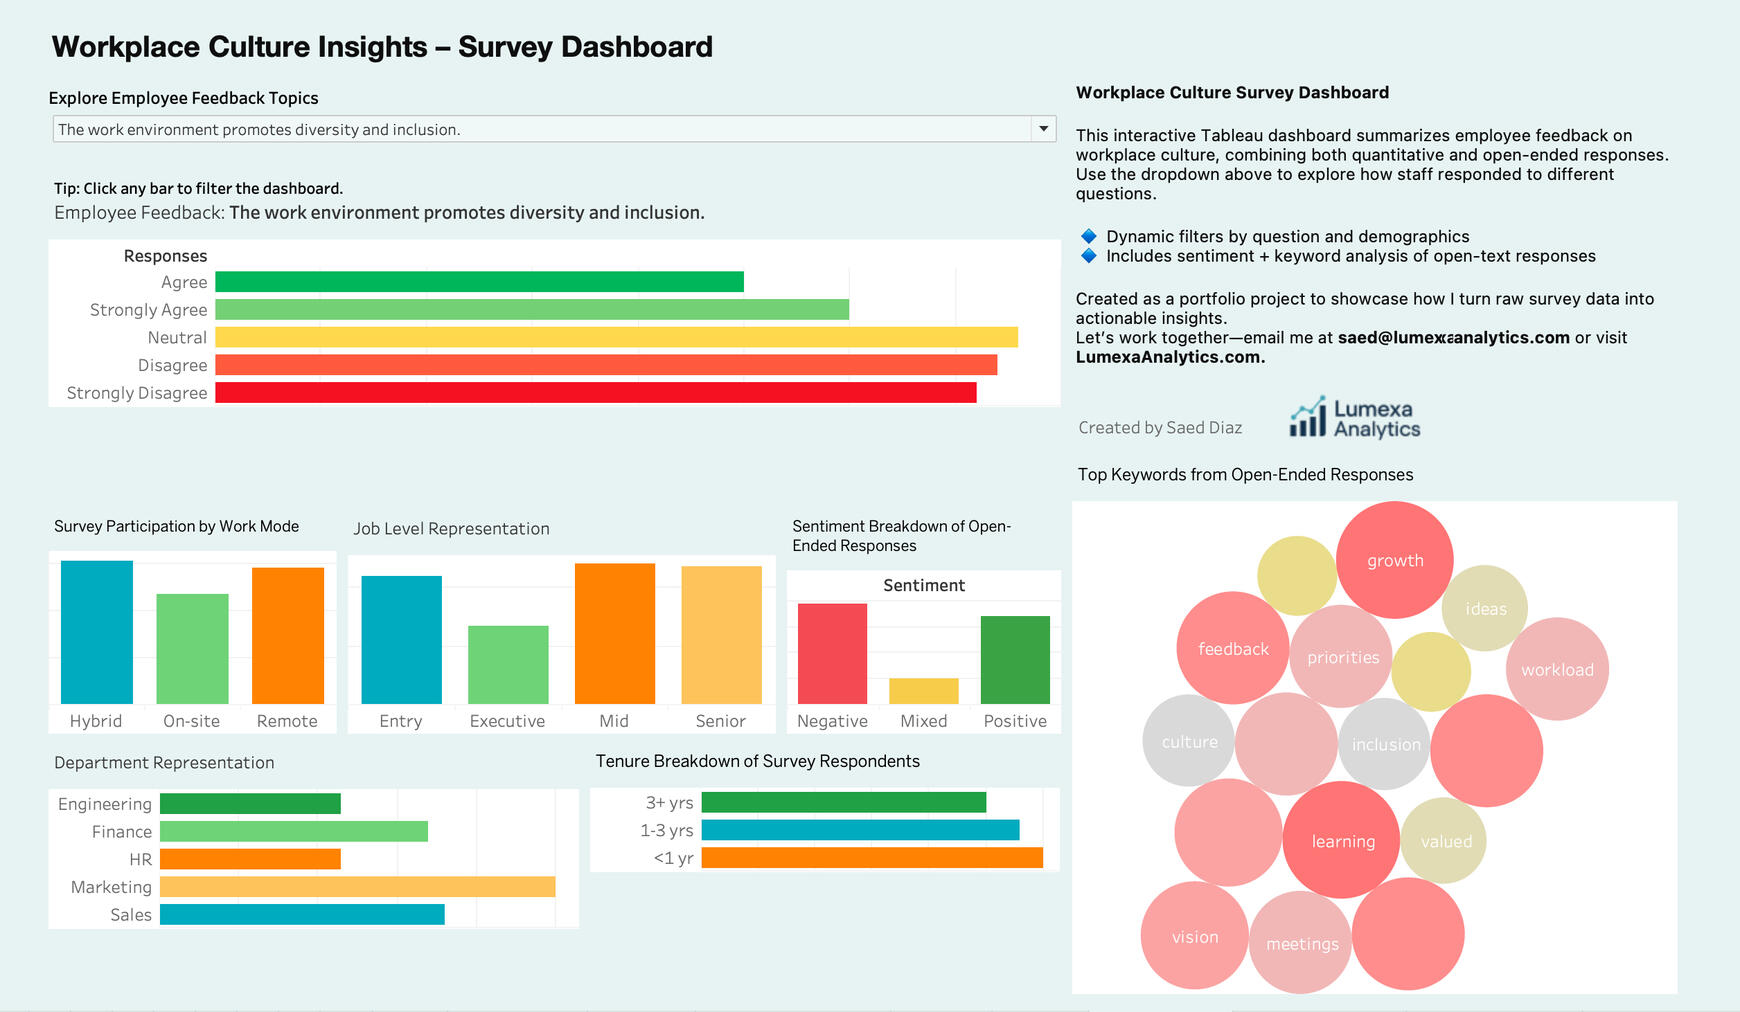
Tableau Survey Dashboard
Bring Your Data to Life.
Our Tableau Survey Dashboard is ideal for sharing insights with broad audiences. Designed for storytelling, it turns raw response data into intuitive visuals—great for CHNAs, stakeholder meetings, or community presentations.
Ready to Make Smarter, Data-Driven Decisions?
Whether you’re leading a nonprofit or a local business, Lumexa Analytics is here to help you discover the story behind your numbers.

Let’s Talk About Your Data Goals
Whether you’re just getting started or already deep in the data, I’d love to hear how I can support your mission. Reach out using the form — or email me directly at [email protected]
© 2025 Lumexa Analytics · Data Consulting With Clarity
Thanks for reaching out!
Your message has been received. We’ll be in touch soon to discuss how Lumexa Analytics can help you move forward with clarity and insight.